Table of Contents
- Executive Summary
- TL;DR
- Why Messaging Observability Is Not Generic API Observability
- Two Clocks: Submission Metrics Versus Delivery Metrics
- The Denominator Bug That Makes Every Delivery Dashboard Lie
- Queue Depth Is Meaningless Without Drain Rate
- The Four Metrics That Actually Predict an Incident
- A Metric Taxonomy for Messaging
- Instrumenting the Send Path
- Building the Delivery Funnel From Real DLR Data
- The Dashboard Analytics API as a Cross-Check
- Error Codes: Turning “Failed” Into Something Actionable
- Cardinality: The Label That Will Take Down Your Metrics Backend
- Alerting on Ratios, Not Counts
- Per-Message-Class SLOs
- The Reconciliation Backlog Is a Deferred Billing Dispute
- Structured Logging and Redaction
- Inbound Observability: Watching Your Own Webhook Receiver
- Dashboard Layout: Four Panels, In This Order
- Incident Review: Symptom to the Metric That Would Have Caught It
- How to Instrument a Messaging Pipeline in Ten Steps
- Decision Matrix
- Implementation Checklist
- Ten Mistakes That Keep Messaging Incidents Invisible
- FAQs
- What This Article Deliberately Does Not Claim
Executive Summary
The metrics that predict a messaging incident are oldest item age, drain rate measured against arrival rate, ambiguous-outcome rate, and cost per delivered message. Queue depth, total messages sent, and a headline delivery percentage are all lagging indicators that turn red only after users have already been affected. The structural reason is that a messaging pipeline runs on two clocks. Submission is synchronous, fast, and the moment you are billed. Delivery is asynchronous, arrives seconds to hours later through a delivery receipt, and is the only thing the recipient experiences. Instrument only the first clock and you build a dashboard that stays green through an outage.
This guide shows how to instrument both clocks against real SMSGatewayCenter endpoints. It covers a Prometheus and OpenTelemetry instrumentation layer for the send path in Python and Node.js, a delivery funnel built from the reports_dlrList payload returned by SMSApi/reports/status, a cross-check against the consolidated SMSApi/dashboard/read analytics endpoint, a nightly contract diff against the two live error code list endpoints, ratio-based alerting rules, a per-message-class SLO table where OTP is the inversion of every normal rule, and an incident review table that maps each observed symptom back to the metric that would have surfaced it hours earlier.
It also names three specific traps that are close to universal. The first is the denominator bug: computing delivery rate as delivered over the sum of delivered and failed, which silently excludes pending and therefore reports a healthy number during the exact failure mode where delivery receipts stop arriving. The second is treating the daily rows of a summary API as if they sum to the overall status breakdown when the two sections count different status sets. The third is labelling metrics with the recipient mobile number, which turns a metrics backend into an unbounded cardinality problem within one campaign.
TL;DR
- Billing fires at submission, satisfaction happens at delivery. These are different clocks. A dashboard that measures only submission is measuring only your spend, not your service.
- Oldest item age is the single best leading indicator. Queue depth of 50,000 during a planned campaign is normal. An oldest item age of nine minutes on a queue that normally drains in four seconds is an incident, regardless of depth.
- Never compute delivery rate as
delivered / (delivered + failed). That formula removes pending from the denominator, so it reports near-perfect health precisely when delivery receipts stop arriving. Always divide by submitted. - Ambiguous outcomes are a first-class metric. A read timeout on a send means you do not know whether you were billed. The rate of these records, and the age of the oldest unreconciled one, belong on the main dashboard.
- Track cost per delivered message, not cost per submitted message. The
costfield in the delivery report payload plus thestatusfield lets you compute the real figure. It is always worse than the rate card, and the gap is where retries and segment inflation hide. - Alert on ratio changes, not absolute counts. Absolute counts alarm on every campaign launch. Ratios do not.
- Latency is a histogram, never an average. The p50 of your submit latency hides the read-timeout tail that generates every ambiguous record you will spend the incident reconciling.
- Cardinality discipline is not optional. Label by sender ID, channel, message class, route and error code. Never by mobile number, transaction ID, or message body.
- OTP inverts the SLO. For OTP, a late message is a failed message. For marketing, a late message is a cheap message. One dashboard cannot serve both.
- An unbounded backlog of unknown-state messages is a deferred billing dispute. Measure it, alert on it, and drain it.
Why Messaging Observability Is Not Generic API Observability
There is no shortage of good generic observability writing. The Prometheus documentation on histograms and summaries and the OpenTelemetry specification will teach you instrumentation mechanics better than any vendor blog. What that material cannot tell you is which of your measurements matter, because that depends on properties of the system being measured. Messaging pipelines have five properties that generic request-response services do not, and each one changes what you should be graphing.
Every request costs money at the moment of submission, not at the moment of success. In an ordinary API integration, a failed call is free. In messaging, a submitted message is billed on submission and the credit does not come back if the handset never receives it. The published billing terms make this explicit: the applicable per-SMS rate is deducted from your wallet while sending SMS, and credits are non-refundable once the SMS is successfully submitted to the operator. This single fact reorders your metric priorities. Submission volume is a spend metric. Delivery volume is a service metric. If you graph only one, you have chosen to monitor either your invoice or your users, and most teams accidentally choose the invoice.
The outcome arrives out of band, minutes to hours later. The synchronous response to a send tells you the platform accepted the request. It does not tell you the message arrived. The real outcome comes back as a delivery receipt, either polled from SMSApi/reports/status or pushed to a webhook you registered. That means half of your outcome data is generated by a process that runs on a completely different schedule from the one that generated the request, and either half can fail independently. A submission path that is perfectly healthy while the DLR path is dead is a very common and very invisible failure.
The unit you are billed in is not the unit you call in. One HTTP request can carry ten thousand recipients, and one message body can occupy three segments. Ten thousand recipients times three segments is thirty thousand billable units from a single request. Any metric expressed in requests per second is therefore not a cost metric and not a throughput metric in any sense the operator cares about. This point is developed at length in Bulk SMS Pricing in India: What Actually Drives Cost, and it has a direct observability consequence: your counters need to increment by recipients times segments, not by one.
Failure is asymmetric across message classes. A marketing message that arrives four hours late costs you almost nothing. An OTP that arrives four hours late costs you the login, a support ticket, and a second charge when the user hits resend. A shipment alert that arrives after the courier does is worse than useless. The same latency number is a non-event, an incident and an embarrassment depending on which lane it happened in, which means a single global latency panel is close to worthless.
Half the logic lives outside your process. DLT scrubbing, operator-level retransmission, DND filtering and carrier queuing all happen where you have no instrumentation and no logs. You will never observe them directly. You can only observe their shadows, which are the cause and globalErrorCode fields on the delivery report and the gap between submit time and delivery time. Designing your instrumentation around those shadows is the entire discipline.
Two Clocks: Submission Metrics Versus Delivery Metrics
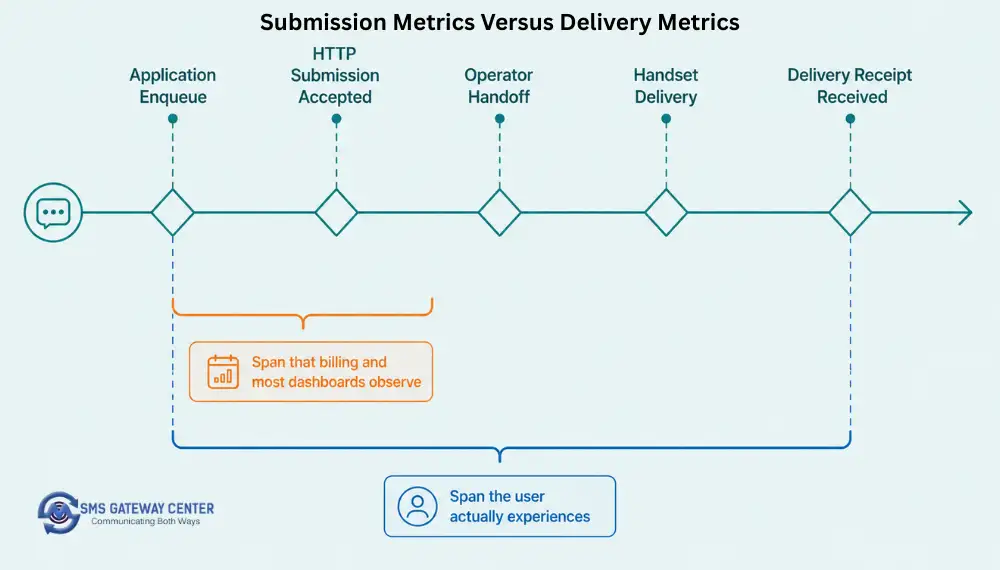
Draw the two clocks explicitly before you write any instrumentation code, because almost every confusing messaging dashboard is confusing for the same reason: it mixes measurements from both clocks into one panel and then averages them.
Clock one, the submission clock, starts when your application decides to send and stops when the HTTP call to https://unify.smsgateway.center/SMSApi/send returns. It is measured in tens or hundreds of milliseconds. It is fully inside your process, so you can instrument it completely. It is the clock on which you are billed. Every metric derived from it is available immediately, which is why teams build their first dashboard entirely from this clock and why that dashboard is misleading.
Clock two, the delivery clock, starts at the same moment but stops when the handset acknowledges, which is reported back to you as a delivery receipt carrying its own submitTime and deliveryTime. It is measured in seconds to hours. Nothing about it is inside your process. It arrives through polling or a webhook push, both of which can break silently.
The two clocks produce four combinations, and the diagnostic value is entirely in the off-diagonal cases:
| Submission clock | Delivery clock | What it means | How most dashboards report it |
|---|---|---|---|
| Healthy | Healthy | Normal operation | Green, correctly |
| Degraded | Healthy | Your own send path is slow, but messages that get through are fine. Usually your database, your queue, or your own connection pool | Amber, correctly |
| Healthy | Degraded | The dangerous one. You are submitting and being billed normally while messages are not arriving. Route problem, DLT scrubbing failure, operator issue, or your DLR pipeline itself is broken | Green, incorrectly, often for hours |
| Degraded | Degraded | A broad outage. Usually obvious | Red, correctly |
The third row is where messaging incidents live. It is invisible to a submission-only dashboard by construction, not by accident. If your monitoring has one gap, it is almost certainly this one.
There is a second-order trap inside the delivery clock. The submitTime and deliveryTime fields on a delivery report are generated by the platform, not by your application. The interval between them is the operator-side latency, which is genuinely useful. But the interval that your user experiences starts when your application decided to send, which is earlier, and includes any time the message spent in your own queue. Track both. If your queue adds ninety seconds before submission, an excellent operator-side latency figure is cold comfort to a user waiting for an OTP.
The Denominator Bug That Makes Every Delivery Dashboard Lie
This deserves its own section because it is the most common single defect in messaging dashboards, it survives code review, and it fails in exactly the direction that hides an outage.
The natural way to compute a delivery rate is to take the messages you know succeeded and divide by the messages whose outcome you know:
# WRONG. Do not ship this.
delivery_rate = delivered / (delivered + failed)
This looks defensible. You are excluding messages whose fate is undetermined, which feels statistically honest. It is not, because of how the failure mode works.
Consider the failure where delivery receipts stop arriving. Your webhook receiver is down, or the DLR poller crashed, or the platform-side DLR flow is delayed. Messages continue to be submitted normally. They sit in your database as pending forever. The delivered count freezes. The failed count freezes. The ratio between two frozen numbers is a constant. Your dashboard shows a delivery rate that is exactly as healthy as it was an hour ago, and it will keep showing that number indefinitely while your entire delivery observability is dead.
The correct denominator is submitted:
# Correct. Pending drags the ratio down, which is the point.
delivery_rate = delivered / submitted
pending_rate  = pending  / submitted
failure_rate  = failed   / submitted
# These three should sum to 1.0. If they do not, you have lost records.
Now the same failure shows up immediately: delivered / submitted falls as new submissions accumulate with no receipts, and pending / submitted climbs toward one. The dashboard turns amber within a few minutes of the DLR path breaking.
Add the invariant check as an actual assertion, not a comment. If delivered + failed + pending + rejected does not equal submitted, you have a bookkeeping bug or a lost record, and you want to know that before you use any of the derived numbers to make a decision.
There is a related nuance in how partial rejection is reported on submission. The documented success response carries an invalidMobile field alongside a top-level status, so a request can return "status": "success" while some recipients in the batch were rejected outright. If your submitted counter increments by the number of recipients you sent, but some of those recipients were enumerated in invalidMobile and never entered the pipeline, your denominator is inflated and your delivery rate will read permanently low by a small margin. Parse invalidMobile, count those recipients into a separate rejected_at_submission counter, and exclude them from the delivery denominator. This is the same normalisation discipline described in Message Idempotency at Scale, and it pays off twice.
Queue Depth Is Meaningless Without Drain Rate
Queue depth is the most graphed and least informative metric in messaging. It is popular because it is trivial to obtain and it produces a satisfying sawtooth. It is uninformative because the same number carries opposite meanings depending on context.
A queue depth of 200,000 five seconds after you launched a campaign to 200,000 recipients is perfect. A queue depth of 400 on a transactional queue that is normally empty is an incident. Depth alone cannot distinguish these, so any threshold you set on it will either miss the second case or alarm constantly on the first.
Depth becomes meaningful only in combination with drain rate, and the combination has a name and a unit that people already understand:
time_to_drain = queue_depth / drain_rate
If depth is 200,000 and you are draining 800 messages per second, time to drain is 250 seconds and everything is fine. If depth is 400 and you are draining 0.2 messages per second, time to drain is 2,000 seconds and your transactional queue has a 33-minute lag. The second is the emergency. Depth ranked them the wrong way round.
Better still, skip the arithmetic and measure the thing directly.
Oldest item age is the age of the oldest unprocessed item currently in the queue. It is the metric that already encodes depth, drain rate, and stalls, and it has the property that its unit is the same unit your users care about, which is seconds of waiting. If the oldest item in your OTP queue is 45 seconds old, you do not need to know the depth or the drain rate to know you have a problem, because 45 seconds is longer than a user will wait before pressing resend.
This metric is standard elsewhere in infrastructure precisely because it works. Cloud queue services expose it directly as approximate age of the oldest message, and pub-sub systems expose the equivalent as oldest unacknowledged message age. If your queue technology gives it to you, use it. If it does not, compute it yourself, which for a database-backed outbox is one cheap query.
-- Oldest item age, in seconds, per message class.
-- Run this on a schedule and export the result as a gauge.
SELECT
    message_class,
    COALESCE(
        EXTRACT(EPOCH FROM (now() - MIN(created_at)))::int,
        0
    ) AS oldest_item_age_seconds,
    COUNT(*) AS depth
FROM outbound_message
WHERE state = 'pending'
GROUP BY message_class;
Two implementation notes that matter. Return zero rather than null for an empty queue, because a null gauge in most metrics backends becomes a gap in the series and a gap in the series will not fire an alert. And group by message class rather than reporting one global figure, because a healthy marketing backlog will mask a stalled OTP queue in any aggregate.
There is one failure mode oldest item age catches that nothing else does: the silent stall. A worker that crashes loudly gets caught by process monitoring. A worker whose event loop is blocked, or that is holding a lock it will never release, or that is stuck in a socket read with no timeout, keeps its process alive and its health check green. Depth may not even rise much if arrival rate is low. The only symptom is that the oldest item stops getting younger. That specific pathology, a blocked event loop producing a no-crash stall, is covered in the queue-worker context in the Node.js integration tutorial.
The Four Metrics That Actually Predict an Incident
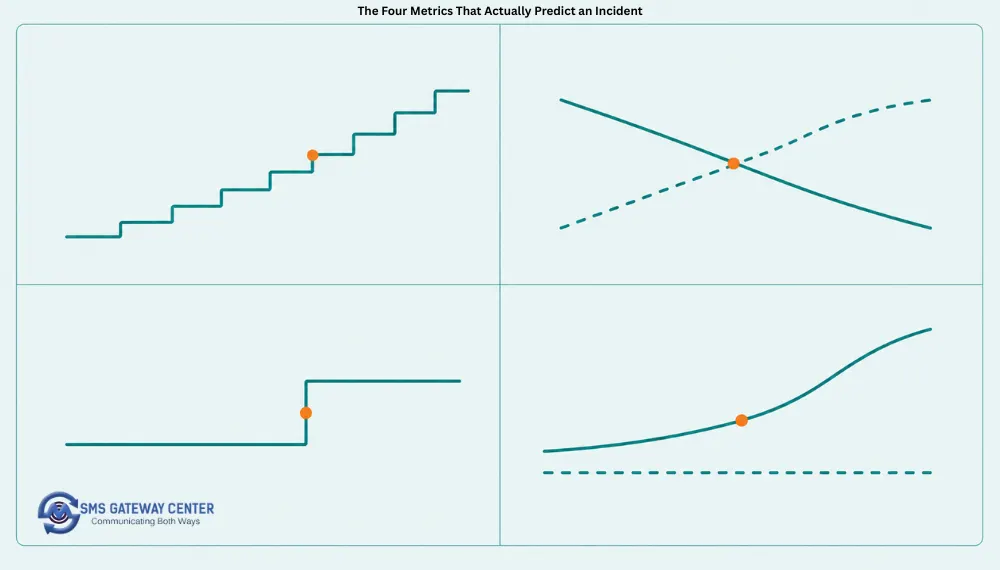
Out of the dozens of things you could measure, four have genuine leading-indicator value, meaning they move before users are affected rather than after. Everything else on your dashboard is either a lagging confirmation or context for interpreting these four.
1. Oldest item age, per message class
Covered above. It is first because it is the only one of the four whose unit is directly comparable to user patience. Alert thresholds should be derived from message class, not from a global default: a value that is unremarkable for a marketing queue is a page for an OTP queue.
2. Drain rate versus arrival rate
Two counters, graphed on the same axis, per class. Arrival rate is how fast work is entering the outbox. Drain rate is how fast it is leaving. The metric is not either line, it is the sign of the difference.
When arrival exceeds drain, the backlog is growing, and the important question is whether that is a transient burst or a sustained inversion. A campaign launch produces a spike where arrival massively exceeds drain for a short window and then drain catches up. That is normal and should not alarm. A sustained inversion, where arrival has exceeded drain for longer than your normal burst window, is the shape that reliably precedes an incident, because it means the backlog will grow without bound until something changes.
The alerting rule that works is not “arrival exceeds drain”, it is “arrival has exceeded drain continuously for longer than N minutes”, where N is comfortably above your longest normal campaign spike. This is the same class of reasoning as burn rate alerting in SLO practice, and for the same reason: you want to alarm on the trajectory, not on the instantaneous value.
Drain rate has a second, counter-intuitive use. A drain rate that suddenly increases while latency drops is often not good news. By Little’s Law, throughput equals concurrency divided by latency, so if your submit latency falls off a cliff your throughput rises to match, and the most common reason for submit latency to fall off a cliff is that the platform started rejecting requests quickly instead of processing them slowly. Fast responses are not automatically good responses. Pair every drain rate panel with a success ratio panel so a rejection storm cannot masquerade as a performance improvement. This dynamic is developed further in the client-side rate limiting material referenced later.
3. Ambiguous-outcome rate
An ambiguous outcome is any send attempt where you do not know whether the platform accepted the message. In practice this is almost always a read timeout: the connection was established, the request was written, and no response came back before your timeout fired. The request may have been fully processed and billed. It may not have been. From inside your process the two are indistinguishable.
This matters more in messaging than anywhere else because the resolution of the ambiguity has a price. Retry and you may pay twice and deliver twice. Do not retry and you may deliver nothing. There is no free option, which is why the correct handling is to route these to an explicit unknown state and reconcile them against the delivery report rather than guessing. That state machine is the subject of Message Idempotency at Scale, and the central rule there is that an ambiguous outcome moves to unknown and never returns to pending.
The observability consequence is that you need two metrics, not one. The rate of new ambiguous outcomes tells you the platform or the network is degrading right now. The age of the oldest unreconciled ambiguous record tells you whether your reconciliation process is keeping up. The first is an incident signal. The second is a billing exposure signal, and it is the one everyone forgets to build.
Critically, the ambiguous-outcome rate is a leading indicator for the submission path in a way that a plain error rate is not. Errors are definite: a 400 is a clean rejection you can classify and act on. Timeouts are the symptom of a system under strain that has not yet started returning errors. The ambiguous rate typically rises before the error rate does.
4. Cost per delivered message
Not cost per submitted message. The rate card gives you the second for free. The first requires joining your cost data to your delivery data, and the gap between them is where every expensive mistake hides.
effective_cost_per_delivered = sum(cost of all submitted) / count(delivered)
If your rate card says 0.14 per SMS and your effective cost per delivered message is 0.19, then roughly a quarter of your spend is producing nothing. That gap comes from a small number of causes, and the ratio tells you which one is worth investigating:
- Messages billed as multiple segments because a body crossed the 160-character GSM-7 boundary, frequently because a curly apostrophe or an en dash was silently substituted into the text and forced the whole message into Unicode at 70 characters per segment.
- Retries that submitted the same message more than once.
- Recipients who were scrubbed, filtered or unreachable, billed at submission and never delivered.
- Duplicate sends from an idempotency gap.
The cost field is present on each row of the reports_dlrList array returned by the delivery report endpoint, alongside status. That is everything you need to compute the real figure without any estimation. Graph it as a slowly moving line and alert on a percentage change rather than an absolute value, because the absolute value legitimately varies with your traffic mix.
A Metric Taxonomy for Messaging
Before writing instrumentation, sort every proposed metric into one of five buckets. Metrics that do not fit a bucket usually do not belong on the dashboard.
| Bucket | Clock | Examples | Primary use | Common misuse |
|---|---|---|---|---|
| Queue metrics | Pre-submission | Oldest item age, depth, arrival rate, drain rate | Predicting an incident before submission is affected | Graphing depth alone and setting a static threshold on it |
| Submission metrics | Submission | Submit latency histogram, HTTP status distribution, ambiguous-outcome rate, recipients times segments counter | Detecting send path and platform degradation, tracking spend | Treating request count as a volume or cost metric |
| Delivery metrics | Delivery | Delivery rate over submitted, pending rate, cause and error code distribution, submit-to-delivery latency histogram | Detecting what users actually experience | Excluding pending from the denominator |
| Reconciliation metrics | Post-delivery | Unknown-state backlog size, oldest unreconciled record age, reconciliation sweep duration | Bounding billing exposure and data quality | Not measuring it at all |
| Cost metrics | Cross-clock | Cost per delivered message, segment inflation ratio, spend per message class | Catching expensive silent regressions | Using rate card numbers instead of the cost field on real records |
The taxonomy has one rule attached to it: never put a metric from the submission bucket and a metric from the delivery bucket on the same panel with the same time axis and no annotation. They are measured on different clocks, so a spike in one will appear to lead or lag a spike in the other by an interval that has no physical meaning, and people will draw causal conclusions from the offset. Either separate the panels or explicitly annotate the delivery panel as lagged.
Instrumenting the Send Path
Every code sample below uses the real send endpoint, POST https://unify.smsgateway.center/SMSApi/send, with the documented parameter names. Full parameter reference is on the Send SMS API documentation page, and the complete endpoint index is at the messaging API hub.
Python: Prometheus instrumentation with the correct cost unit
"""
Instrumented send path for SMSGatewayCenter.

Key decisions, each of which is deliberate:
  * Latency is a Histogram, never a Summary or a gauge of the mean.
  * Buckets are chosen around the timeout boundary, not log-spaced by habit.
  * The volume counter increments by recipients * segments, not by 1.
  * Connect timeout and read timeout are separated because they mean
    completely different things for billing.
  * Labels are strictly bounded. No mobile numbers anywhere.
"""

import time
import httpx
from prometheus_client import Counter, Histogram, Gauge

# ---------------------------------------------------------------------------
# Metric definitions
# ---------------------------------------------------------------------------

# Buckets straddle the read timeout (10.0s here). The bucket immediately
# below the timeout is the one that tells you how close to the cliff you are
# running. Default Prometheus buckets top out at 10s and will not show you
# this, which is why they are wrong for this use case.
SUBMIT_LATENCY = Histogram(
    "messaging_submit_latency_seconds",
    "Wall-clock latency of a single submission request.",
    ["channel", "message_class"],
    buckets=(0.05, 0.1, 0.25, 0.5, 1.0, 2.0, 4.0, 6.0, 8.0, 10.0, 15.0, 30.0),
)

# THE IMPORTANT ONE. Incremented by recipients * segments, because that is
# the unit you are billed in. A counter of requests is not a volume metric.
SUBMITTED_UNITS = Counter(
    "messaging_submitted_units_total",
    "Billable units submitted (recipients x segments).",
    ["channel", "message_class", "encoding", "senderid"],
)

SUBMIT_OUTCOME = Counter(
    "messaging_submit_outcome_total",
    "Outcome of each submission attempt.",
    # outcome is one of: accepted, rejected, ambiguous, connect_failed
    ["channel", "message_class", "outcome", "status_code"],
)

# Separate from the outcome counter because this is the metric that gets its
# own alert and its own panel. Duplicating it is cheap and worth it.
AMBIGUOUS_OUTCOMES = Counter(
    "messaging_ambiguous_outcomes_total",
    "Sends whose acceptance is unknown (read timeout after write).",
    ["channel", "message_class"],
)

REJECTED_AT_SUBMISSION = Counter(
    "messaging_rejected_at_submission_total",
    "Recipients enumerated in invalidMobile and never entered the pipeline.",
    ["channel", "message_class"],
)

# ---------------------------------------------------------------------------
# The instrumented call
# ---------------------------------------------------------------------------

SEND_URL = "https://unify.smsgateway.center/SMSApi/send"


def submit(client: httpx.Client, *, recipients, body, senderid,
           message_class, dlt_entity_id=None, dlt_template_id=None):
    """
    Submit one request and record every metric that matters.

    Returns a dict describing the outcome. Never raises for a transport
    problem; the caller needs the classification, not an exception.
    """
    segments, encoding = count_segments(body)   # see the GSM-7 counter below
    units = len(recipients) * segments
    labels = {"channel": "sms", "message_class": message_class}

    payload = {
        "sendMethod": "quick",
        "mobile": ",".join(recipients),
        "msg": body,
        "senderid": senderid,
        "msgType": "unicode" if encoding == "UNICODE" else "text",
        "output": "json",
        # Within-request recipient deduplication. This is NOT a retry guard
        # and has no cross-request time window. Default is true.
        "duplicatecheck": "true",
    }
    if dlt_entity_id:
        payload["dltEntityId"] = dlt_entity_id
    if dlt_template_id:
        payload["dltTemplateId"] = dlt_template_id

    started = time.monotonic()
    try:
        response = client.post(SEND_URL, data=payload)

    except httpx.ConnectTimeout:
        # DEFINITE non-submission. The connection was never established,
        # so nothing was written, so nothing was billed. Safe to retry.
        SUBMIT_LATENCY.labels(**labels).observe(time.monotonic() - started)
        SUBMIT_OUTCOME.labels(**labels, outcome="connect_failed",
                              status_code="none").inc()
        return {"state": "not_submitted", "retryable": True, "units": units}

    except httpx.ReadTimeout:
        # AMBIGUOUS. The request was written. It may have been processed and
        # billed. Record the units as submitted, because the pessimistic
        # assumption is the correct one for a spend metric.
        SUBMIT_LATENCY.labels(**labels).observe(time.monotonic() - started)
        SUBMIT_OUTCOME.labels(**labels, outcome="ambiguous",
                              status_code="none").inc()
        AMBIGUOUS_OUTCOMES.labels(**labels).inc()
        SUBMITTED_UNITS.labels(**labels, encoding=encoding,
                               senderid=senderid).inc(units)
        return {"state": "unknown", "retryable": False, "units": units}

    SUBMIT_LATENCY.labels(**labels).observe(time.monotonic() - started)
    parsed = response.json()

    # statusCode is a QUOTED string on SMSApi/send and an unquoted number on
    # WAApi/send. Coerce, always.
    status_code = str(parsed.get("statusCode", "")).strip()
    status = str(parsed.get("status", "")).strip().lower()

    if status == "success":
        SUBMIT_OUTCOME.labels(**labels, outcome="accepted",
                              status_code=status_code).inc()
        SUBMITTED_UNITS.labels(**labels, encoding=encoding,
                               senderid=senderid).inc(units)

        # A populated invalidMobile is a PARTIAL success. Those recipients
        # never entered the pipeline and must not sit in your delivery
        # denominator inflating your pending rate forever.
        invalid = [m for m in str(parsed.get("invalidMobile", "")).split(",")
                   if m.strip()]
        if invalid:
            REJECTED_AT_SUBMISSION.labels(**labels).inc(len(invalid))

        return {
            "state": "submitted",
            "transaction_id": str(parsed.get("transactionId", "")),
            "invalid": invalid,
            "units": units,
        }

    SUBMIT_OUTCOME.labels(**labels, outcome="rejected",
                          status_code=status_code).inc()
    return {"state": "rejected", "status_code": status_code,
            "reason": parsed.get("reason"), "units": units}
Three things in that listing are worth stating plainly because they are where most instrumentation goes wrong.
The bucket boundaries are chosen, not defaulted. The default Prometheus histogram buckets are tuned for fast web requests and stop at ten seconds. If your read timeout is ten seconds, the default buckets give you no resolution at all in the region where the interesting behaviour happens. Put buckets immediately below and immediately above your timeout so you can see the distribution creeping toward the cliff before it goes over.
The counter increments by units, not by one. This is the difference between a metric that answers “how much did that cost” and a metric that answers nothing. If you take one idea from this section, take this one.
Connect timeout and read timeout are caught separately. A requests-style except Timeout that catches both is discarding the single most important distinction in the whole system, because one means definitely not billed and the other means possibly billed. The Python-specific version of this trap is covered in detail in the Python integration tutorial.
The segment counter the volume metric depends on
The units counter above is only as good as count_segments. Getting it wrong understates your volume metric by exactly the amount that matters.
GSM7_BASIC = set(
    "@£$¥èéùìòÇ\nØø\rÅåΔ_ΦΓΛΩΠΨΣΘΞÆæßÉ !\"#¤%&'()*+,-./0123456789:;<=>?"
    "¡ABCDEFGHIJKLMNOPQRSTUVWXYZÄÖÑܧ¿abcdefghijklmnopqrstuvwxyzäöñüà"
)
# These ten cost TWO septets each, because they are encoded as an escape
# character followed by the character itself.
GSM7_EXTENDED = set("^{}\\[~]|€")


def count_segments(text: str):
    """
    Return (segment_count, encoding) where encoding is 'TEXT' or 'UNICODE'.

    Iterate code points, not UTF-16 code units. In Python, iterating a str
    already gives code points, which is why this is simpler here than the
    equivalent in JavaScript, where split('') will tear an astral-plane
    emoji in half and give you the wrong answer.
    """
    septets = 0
    for ch in text:
        if ch in GSM7_BASIC:
            septets += 1
        elif ch in GSM7_EXTENDED:
            septets += 2
        else:
            # One non-GSM-7 character forces the ENTIRE message to UCS-2.
            # A single curly apostrophe does this. So does an en dash,
            # an ellipsis character, and the rupee sign.
            units = len(text.encode("utf-16-be")) // 2
            if units <= 70:
                return 1, "UNICODE"
            return -(-units // 67), "UNICODE"   # ceiling division

    if septets <= 160:
        return 1, "TEXT"
    return -(-septets // 153), "TEXT"
The autocorrect trap embedded in that comment is worth a dedicated alert. If a template that has always billed as one TEXT segment starts billing as three UNICODE segments, a single character was substituted somewhere upstream, almost always by a rich text editor turning a straight apostrophe into a curly one. Your cost per delivered message will jump by a factor of three and nothing else will look wrong. Alert on the encoding label of messaging_submitted_units_total shifting from TEXT to UNICODE for a sender ID that has historically been TEXT.
You do not have to trust your own counter in isolation, either. The platform exposes POST https://unify.smsgateway.center/SMSApi/info/msg, documented on the SMS length and cost page, which returns msgList with encoding, length, remaining and credit for a given body. Call it in CI against your template corpus and assert that your local counter agrees with it. That converts a subtle billing bug into a failing test, which is the general strategy argued for at length in the testing material referenced in the internal links section. The underlying segment tables are published on the text messages chart page.
Node.js: OpenTelemetry instrumentation
// Node.js instrumentation using the OpenTelemetry metrics API.
//
// Note the two Node-specific hazards this guards against:
//   1. fetch() in Node has NO default timeout. Without AbortSignal.timeout
//      a hung socket produces a request that never resolves, which means
//      no metric is ever recorded and the message is invisible forever.
//      An unrecorded send is worse than a failed send.
//   2. AbortError from a timeout is AMBIGUOUS. It is not an error you can
//      safely retry.

import { metrics } from '@opentelemetry/api';

const meter = metrics.getMeter('messaging-pipeline', '1.0.0');

const submitLatency = meter.createHistogram('messaging.submit.latency', {
  description: 'Latency of a single submission request',
  unit: 's',
  advice: {
    explicitBucketBoundaries: [0.05, 0.1, 0.25, 0.5, 1, 2, 4, 6, 8, 10, 15, 30],
  },
});

const submittedUnits = meter.createCounter('messaging.submitted.units', {
  description: 'Billable units submitted (recipients x segments)',
});

const submitOutcome = meter.createCounter('messaging.submit.outcome', {
  description: 'Outcome classification of each submission attempt',
});

const SEND_URL = 'https://unify.smsgateway.center/SMSApi/send';

export async function submit({ recipients, body, senderid, messageClass,
                               dltEntityId, dltTemplateId, apiKey }) {
  const { segments, encoding } = countSegments(body);
  const units = recipients.length * segments;
  const attrs = { channel: 'sms', 'message.class': messageClass, encoding, senderid };

  const form = new URLSearchParams({
    sendMethod: 'quick',
    mobile: recipients.join(','),
    msg: body,
    senderid,
    msgType: encoding === 'UNICODE' ? 'unicode' : 'text',
    output: 'json',
    duplicatecheck: 'true',
  });
  if (dltEntityId) form.set('dltEntityId', dltEntityId);
  if (dltTemplateId) form.set('dltTemplateId', dltTemplateId);

  const started = process.hrtime.bigint();
  const elapsed = () => Number(process.hrtime.bigint() - started) / 1e9;

  let response;
  try {
    response = await fetch(SEND_URL, {
      method: 'POST',
      headers: {
        apikey: apiKey,
        'content-type': 'application/x-www-form-urlencoded',
      },
      body: form,
      // Without this line, a hung socket produces a promise that never
      // settles and a metric that is never recorded.
      signal: AbortSignal.timeout(10_000),
    });
  } catch (err) {
    submitLatency.record(elapsed(), attrs);

    if (err.name === 'TimeoutError' || err.name === 'AbortError') {
      // Ambiguous. Count the units as submitted; assume you were billed.
      submitOutcome.add(1, { ...attrs, outcome: 'ambiguous' });
      submittedUnits.add(units, attrs);
      return { state: 'unknown', retryable: false, units };
    }

    // Connection-level failures (ENOTFOUND, ECONNREFUSED) are definite
    // non-submissions and are safe to retry.
    submitOutcome.add(1, { ...attrs, outcome: 'connect_failed' });
    return { state: 'not_submitted', retryable: true, units };
  }

  submitLatency.record(elapsed(), attrs);
  const parsed = await response.json();

  // Coerce: quoted string here, unquoted number on the WhatsApp endpoint.
  const statusCode = String(parsed.statusCode ?? '');
  const ok = String(parsed.status ?? '').toLowerCase() === 'success';

  submitOutcome.add(1, {
    ...attrs,
    outcome: ok ? 'accepted' : 'rejected',
    'status.code': statusCode,
  });
  if (ok) submittedUnits.add(units, attrs);

  return {
    state: ok ? 'submitted' : 'rejected',
    transactionId: parsed.transactionId ? String(parsed.transactionId) : null,
    invalid: String(parsed.invalidMobile ?? '').split(',').filter(Boolean),
    statusCode,
    units,
  };
}
cURL: verifying the shape before you parse it
Before writing a parser, confirm the response shape against your own account. The relevant discipline is to build your instrumentation around what you observed, not what you assumed.
# Note testMessage=true. Documented verbatim as:
# "Enable true to test your message and messages wont be delivered when
#  enabled true."
# It lets you exercise the submission path and inspect the exact response
# shape without a message landing on a real handset.
curl --location 'https://unify.smsgateway.center/SMSApi/send' \
  --header 'apikey: YOUR_API_KEY' \
  --header 'Content-Type: application/x-www-form-urlencoded' \
  --data-urlencode 'sendMethod=quick' \
  --data-urlencode 'mobile=919999999999,919999999998' \
  --data-urlencode 'msg=Instrumentation shape check' \
  --data-urlencode 'senderid=YOURID' \
  --data-urlencode 'msgType=text' \
  --data-urlencode 'output=json' \
  --data-urlencode 'testMessage=true'
Two cautions on that flag. The documentation states that messages will not be delivered when it is enabled. It says nothing about whether credits are consumed, whether a delivery receipt is generated, or whether the response body differs from a live send. Those three behaviours are not documented, so do not assume them. Determine them empirically on your own account: read your balance from the dashboard endpoint, send one message with the flag set, read the balance again, then poll the delivery report for that time window and see whether a record appears. Record the answer in your own runbook, because your instrumentation’s treatment of test traffic depends on it.
If you would rather not write the first request by hand at all, the SMS Postman collection gives you the exact request shape as a fixture.
Building the Delivery Funnel From Real DLR Data
The delivery funnel is the panel that makes the second clock visible. It is built from SMSApi/reports/status, documented on the SMS Delivery Report API page.
The endpoint is GET or POST to https://unify.smsgateway.center/SMSApi/reports/status with method=getDlr, fromdate, todate, pageLimit, output, and optional mobileNo, uuId or startCursor. The response carries a reports_dlrList array whose rows contain the fields you need: status, cause, globalErrorCode, cost, submitTime, deliveryTime, msgId, uuId, mobileNo, senderName, network, country, channel, msgType, length, dltTemplateId, amount, flashMsg, text and cursorId.
Two structural properties of this endpoint matter for instrumentation design.
It is a read endpoint, which means transport-level retries against it are safe. This is the opposite of the send path, where an automatic retry layer will double-bill you. Configure your HTTP client differently for the two, and if you use a shared client, be certain the retry policy is not global. A urllib3 Retry with allowed_methods including POST, applied to a shared session, is a documented way to double-send.
It is cursor-paced, via startCursor and the cursorId on each row. That makes it consumer-paced rather than producer-paced, which means your poller cannot be overwhelmed by a volume spike. You pull the next page when you are ready. Use that property: do not try to hold a full day of records in memory, iterate.
Python: a funnel builder that computes the right denominators
"""
Poll the delivery report and emit funnel metrics.

Design notes:
  * Cursor-paced, so memory is bounded regardless of volume.
  * cost is parsed with Decimal, never float. Money is not binary floating
    point and a cost dashboard that drifts is a cost dashboard nobody trusts.
  * The submit-to-delivery gap is recorded as a HISTOGRAM. The average of
    this number is meaningless because the distribution is heavily bimodal:
    most messages land in seconds, a tail lands in minutes, and the mean
    sits in a valley where almost no real message lives.
"""

from decimal import Decimal
from datetime import datetime
from prometheus_client import Counter, Histogram

DLR_URL = "https://unify.smsgateway.center/SMSApi/reports/status"

DELIVERY_OUTCOME = Counter(
    "messaging_delivery_outcome_total",
    "Terminal delivery outcomes, from the delivery report.",
    ["channel", "status", "cause", "network", "senderid"],
)

DELIVERY_COST = Counter(
    "messaging_delivery_cost_total",
    "Summed cost from delivery report rows, in account currency units.",
    ["channel", "status", "senderid"],
)

# Buckets in SECONDS. Note how far right they run. A messaging latency
# histogram that stops at 10 seconds is measuring the wrong system; real
# operator-side delivery routinely has a multi-minute tail and you need
# to see it, because that tail is what your OTP users experience.
DELIVERY_LATENCY = Histogram(
    "messaging_delivery_latency_seconds",
    "Gap between platform submitTime and deliveryTime.",
    ["channel", "network", "message_class"],
    buckets=(1, 2, 5, 10, 20, 30, 60, 120, 300, 600, 1800, 3600),
)

TS_FORMAT = "%Y-%m-%d %H:%M:%S"


def poll_dlr(session, *, userid, password, fromdate, todate, page_limit=500):
    """Yield reports_dlrList rows, following the cursor to exhaustion."""
    cursor = None
    while True:
        payload = {
            "method": "getDlr",
            "userid": userid,
            "password": password,
            "fromdate": fromdate,
            "todate": todate,
            "pageLimit": str(page_limit),
            "output": "json",
        }
        if cursor:
            payload["startCursor"] = cursor

        # Safe to retry: this is a read endpoint.
        response = session.post(DLR_URL, data=payload, timeout=(5, 30))
        body = response.json()
        rows = body.get("reports_dlrList") or []
        if not rows:
            return

        for row in rows:
            yield row

        cursor = rows[-1].get("cursorId")
        if not cursor or len(rows) < page_limit:
            return


def record(row, message_class_lookup):
    """Turn one DLR row into metrics. Bounded labels only."""
    status = str(row.get("status", "unknown")).lower()
    cause = str(row.get("cause", "") or "none")
    network = str(row.get("network", "") or "unknown")
    senderid = str(row.get("senderName", "") or "unknown")
    channel = str(row.get("channel", "sms")).lower()

    DELIVERY_OUTCOME.labels(
        channel=channel, status=status, cause=cause,
        network=network, senderid=senderid,
    ).inc()

    # Decimal, not float.
    raw_cost = row.get("cost")
    if raw_cost not in (None, ""):
        DELIVERY_COST.labels(
            channel=channel, status=status, senderid=senderid,
        ).inc(float(Decimal(str(raw_cost))))

    submit_time = row.get("submitTime")
    delivery_time = row.get("deliveryTime")
    if submit_time and delivery_time:
        try:
            gap = (datetime.strptime(delivery_time, TS_FORMAT)
                   - datetime.strptime(submit_time, TS_FORMAT)).total_seconds()
        except (ValueError, TypeError):
            return
        # Negative gaps happen. Clock skew between platform components,
        # or a receipt for a message submitted before your window opened.
        # Drop them rather than letting a negative observation corrupt
        # the histogram.
        if gap >= 0:
            DELIVERY_LATENCY.labels(
                channel=channel,
                network=network,
                message_class=message_class_lookup(row.get("msgId")),
            ).observe(gap)
Notice what is deliberately absent from every label set: mobileNo, msgId, uuId and text. Those are per-message identifiers and message content. They belong in your logs and your database, never in a metric label. The next section explains why in concrete terms.
Notice also the message_class_lookup call. The delivery report does not know whether a message was an OTP or a marketing blast; that is your business classification. You have to join it back from your own records using msgId or uuId. This join is the single most valuable piece of enrichment in the whole pipeline, because without it every per-class SLO in this article is unimplementable. Build the lookup as a bounded cache keyed on message ID, and if the lookup misses, label the class as unknown rather than dropping the observation.
The PromQL that turns those counters into the funnel
# Delivery rate, computed against SUBMITTED. Note the denominator.
sum by (message_class) (
  rate(messaging_delivery_outcome_total{status="delivered"}[30m])
)
/
sum by (message_class) (
  rate(messaging_submitted_units_total[30m])
)

# Pending rate. This is the metric that catches a dead DLR pipeline.
# It should be small and stable. A sustained climb means receipts have
# stopped arriving, even though everything else looks fine.
1 - (
  sum by (message_class) (rate(messaging_delivery_outcome_total[30m]))
  /
  sum by (message_class) (rate(messaging_submitted_units_total[30m]))
)

# Effective cost per DELIVERED message.
sum by (senderid) (rate(messaging_delivery_cost_total[1h]))
/
sum by (senderid) (rate(messaging_delivery_outcome_total{status="delivered"}[1h]))

# p95 of operator-side delivery latency. Not the mean. Never the mean.
histogram_quantile(0.95,
  sum by (le, message_class) (rate(messaging_delivery_latency_seconds_bucket[30m]))
)

# Ambiguous-outcome ratio. Leading indicator for submission-path strain.
sum(rate(messaging_ambiguous_outcomes_total[5m]))
/
sum(rate(messaging_submit_outcome_total[5m]))
The second query deserves emphasis. Pending rate expressed as one minus the terminal-outcome rate is the closest thing this article offers to a single number that says “your delivery observability is working”. It rises when receipts stop arriving, it rises when your poller falls behind, and it rises when the operator is genuinely slow. All three are things you want to know about, and none of them show up on a submission dashboard.
The Dashboard Analytics API as a Cross-Check
There is a consolidated analytics endpoint that most integrations never discover: POST or GET to https://unify.smsgateway.center/SMSApi/dashboard/read, documented on the Dashboard Analytics API page. It takes startDate and endDate in YYYY-MM-DD form, both optional and defaulting to today, with a documented maximum range of 31 days, plus output.
It returns four sections under response.dashboard:
| Section | Contents | Observability use |
|---|---|---|
topBar | balance, balanceRaw, balanceCurrency, balanceCredits, lastPurchaseAmount, lastPurchaseDate, groups, contacts, creditType | Balance as a first-class alertable metric, and burn rate |
sentSummary | data[] of {date, dateFormatted, submitted, delivered, failed, pending} plus totalSubmitted, averagePerDay, startDate, endDate, days | Daily reconciliation against your own counters |
donutInfo | data[] of {label, value, labelColor} across Submitted, Delivered, Failed, Pending and Rejected, plus the date range | Whole-period status breakdown |
chartColors | Colour assignments per status | Presentation only, ignore for metrics |
Three practical notes, and one of them is a genuine trap.
Use it as a cross-check, not as your primary source. It is a daily-granularity aggregate. You cannot alert on a five-minute window with it, you cannot get per-message detail from it, and you cannot join it to your own message classes. Your primary delivery data must come from reports_dlrList. What this endpoint gives you is an independent second opinion, computed platform-side, against which you can validate your own aggregation. If your locally computed daily delivered count and the platform’s sentSummary delivered count for the same day differ by more than a rounding margin, one of the two is wrong and you want to find out which before you make a decision based on either.
The trap: sentSummary daily rows and donutInfo do not count the same status set. Each daily row in sentSummary carries submitted, delivered, failed and pending. There is no rejected field on a daily row. But donutInfo reports five labels including Rejected. If you sum the daily rows and compare that total to the donut, they will not agree whenever any messages were rejected, and the discrepancy will look like a data integrity bug in your own code. It is not. It is a difference in what each section counts. Reconcile against the section that carries the field you are checking, and never assume one is a rollup of the other.
Balance is an alertable metric and almost nobody alerts on it. topBar.balanceRaw gives you a numeric balance and creditType tells you whether the account is credit-based or wallet-based, which changes what the number means. Running out of credit mid-campaign produces a failure that looks exactly like a platform outage from inside your application: sends start failing for a reason your error classifier has probably never seen. Two alerts fix this permanently. One on absolute balance below a floor. One on projected time to exhaustion, computed as balance divided by recent daily burn from sentSummary.averagePerDay, firing when it drops below your procurement lead time. The second is far more useful than the first, because a floor that is right for a quiet week is wrong for a campaign week.
"""
Nightly cross-check and balance projection.
Chunk your date range: the endpoint documents a 31-day maximum.
"""
from decimal import Decimal

DASHBOARD_URL = "https://unify.smsgateway.center/SMSApi/dashboard/read"


def cross_check(session, *, api_key, start_date, end_date, local_daily_counts):
    response = session.post(
        DASHBOARD_URL,
        headers={"apikey": api_key},
        data={"startDate": start_date, "endDate": end_date, "output": "json"},
        timeout=(5, 30),
    )
    dashboard = response.json()["response"]["dashboard"]

    discrepancies = []
    for row in dashboard["sentSummary"]["data"]:
        day = row["date"]
        platform_submitted = int(row["submitted"])
        local_submitted = local_daily_counts.get(day, 0)
        if platform_submitted == 0 and local_submitted == 0:
            continue
        drift = abs(platform_submitted - local_submitted)
        denominator = max(platform_submitted, local_submitted, 1)
        if drift / denominator > 0.01:      # tolerate 1 percent
            discrepancies.append({
                "date": day,
                "platform": platform_submitted,
                "local": local_submitted,
                "drift_pct": round(100 * drift / denominator, 2),
            })

    # Balance projection. Far more actionable than a static floor.
    balance = Decimal(str(dashboard["topBar"]["balanceRaw"]))
    per_day = Decimal(str(dashboard["sentSummary"]["averagePerDay"] or 0))
    days_remaining = float(balance / per_day) if per_day > 0 else float("inf")

    return {
        "discrepancies": discrepancies,
        "balance_raw": balance,
        "credit_type": dashboard["topBar"]["creditType"],
        "projected_days_remaining": days_remaining,
    }
If you want the human-facing version of this data rather than the programmatic one, the platform ships a built-in analytics view covered in Customer Insights and Analytics, which walks through template performance, campaign performance and error breakdowns in the control panel. That article and this one are complements: it explains the dashboard you are given, this one explains the dashboard you have to build. It is also worth knowing the platform distinguishes between a per-message delivery report and an aggregated delivery summary, explained in the knowledge base entry on the difference, because picking the wrong one is a common reason people conclude data is missing.
Error Codes: Turning “Failed” Into Something Actionable
A failed counter with no breakdown is a smoke alarm with no location. The cause and globalErrorCode fields on each delivery report row are what turn it into a diagnosis, and the platform publishes both code lists as live endpoints.
POST https://unify.smsgateway.center/SMSApi/info/responsecodesreturnsresponsecodesList, an array of{errorcode, httpCode, status, description}. Documented on the API response error code list page.POST https://unify.smsgateway.center/SMSApi/info/deliverycodesreturnsdeliverycodesList, an array of{peId, identifier, status, cause}. Documented on the delivery error code list page.
Both are read-only and free to call, which makes them the best available live contract surface. Two things follow.
Run a nightly diff against the codes your application handles. Fetch both lists, compare against your classifier’s known set, and fail the job if a code appears that you have no handling for. A new code that your classifier does not recognise is a silent bucket of failures that will accumulate as unknown and never trigger anything.
Default unknown codes to permanent, never to transient. This is a rule with a specific financial justification. If an unrecognised code defaults to transient, your retry logic will resubmit the message, be billed again, receive the same unrecognised code again, and resubmit again. That is an infinite billing loop driven by a code list update you did not notice. Defaulting to permanent means an unrecognised code produces an undelivered message and an alert, which is a bounded and correctable failure. Choose the bounded one.
"""
Nightly contract check against the two live code lists.
Exits non-zero in CI when the platform knows a code your code does not.
"""
import sys

RESPONSE_CODES_URL = "https://unify.smsgateway.center/SMSApi/info/responsecodes"
DELIVERY_CODES_URL = "https://unify.smsgateway.center/SMSApi/info/deliverycodes"

# The codes your classifier explicitly handles. Keep this in version control
# next to the classifier itself so the two cannot drift apart.
HANDLED_RESPONSE_CODES = {"200", "188", "300", "301"}
HANDLED_DELIVERY_CAUSES = {
    "DELIVRD", "ABSENT_SUB", "OPERATOR_DOWN", "DUPLICATE_FAIL",
    "TEMPLATE_CHECK_FAILED", "DLT_REJECTED", "SYSTEM_FAIL",
    "BLOCKED_SENDERID", "INVALID_SENDERID", "CONSENT_FAILED", "IN_RETRY",
}


def check(session, api_key):
    unhandled = []

    r = session.post(RESPONSE_CODES_URL, headers={"apikey": api_key},
                     data={"output": "json"}, timeout=(5, 30)).json()
    for entry in r.get("responsecodesList", []):
        code = str(entry.get("errorcode", "")).strip()
        if code and code not in HANDLED_RESPONSE_CODES:
            unhandled.append(("response", code, entry.get("description", "")))

    d = session.post(DELIVERY_CODES_URL, headers={"apikey": api_key},
                     data={"output": "json"}, timeout=(5, 30)).json()
    for entry in d.get("deliverycodesList", []):
        identifier = str(entry.get("identifier", "")).strip().upper()
        if identifier and identifier not in HANDLED_DELIVERY_CAUSES:
            unhandled.append(("delivery", identifier, entry.get("cause", "")))

    if unhandled:
        print("Unhandled codes detected. Classify each before it appears "
              "in production traffic:")
        for kind, code, description in unhandled:
            print(f"  [{kind}] {code}: {description}")
        sys.exit(1)

    print(f"Contract OK. {len(HANDLED_RESPONSE_CODES)} response codes and "
          f"{len(HANDLED_DELIVERY_CAUSES)} delivery causes accounted for.")
The HANDLED_DELIVERY_CAUSES set above is seeded from causes documented in the knowledge base, each of which has a dedicated entry worth reading when it first appears in your data: what DELIVRD and the other DLR statuses mean, absent subscriber, operator unreachable, template mismatch, duplicate fail, retry attempted, and DLT rejected. Treat the list in your code as the contract and the knowledge base as the explanation.
The India-specific failure signature worth its own panel
If you send in India under DLT, one failure class deserves a dedicated panel rather than sitting inside a general error breakdown: template scrubbing failures. They have a distinctive signature that no other failure shares.
The signature is a sudden, total, sender-ID-scoped failure with a template-related cause. Not a partial degradation, not a network-scoped issue. Every message using one template starts failing at once, usually immediately after someone edited that template’s content, changed a sender ID binding, or switched providers. The cause field carries a template or DLT identifier, and the API-side equivalent is status code 188, message template mismatch.
Build the panel as a breakdown of failure count by dltTemplateId, which the delivery report conveniently carries on every row. A single template ID going from zero failures to one hundred percent failures inside one minute is unmistakable on that panel and nearly invisible on an aggregate error graph, because one template out of two hundred failing completely may only move the global error rate by half a percent.
The cure is upstream of observability: validate before you send. POST https://unify.smsgateway.center/SMSApi/validateTemplate with senderid, msg and dltTemplateId returns a clean success or a 188 mismatch, and running it in CI over your template corpus converts a production incident into a failed build. The full treatment, including the twenty-four-row rejection reason table and the character substitution traps that cause most of these, is in DLT Template Rejected: Every Reason and How to Fix It, and the registration and binding side is covered in the DLT registration step-by-step guide.
Cardinality: The Label That Will Take Down Your Metrics Backend
Cardinality is the number of distinct label combinations a metric produces. Every combination is a separate time series with its own memory and storage cost. In most systems this stays manageable by accident. In messaging it does not, because the most obviously useful label is also unbounded.
Labelling a metric with the recipient mobile number produces one time series per recipient. A single campaign to two hundred thousand recipients produces two hundred thousand series in one afternoon, each of which is retained for your full retention window, each of which is queried by every dashboard that touches that metric. This is not a slow degradation. It is an outage of your monitoring system, caused by your monitoring system, during a campaign, which is exactly when you need it. The same applies to transaction IDs, message IDs and anything derived from message content.
| Label | Cardinality | Verdict | Reasoning |
|---|---|---|---|
channel | Under 10 | Safe | sms, whatsapp, voice, rcs |
message_class | Under 20 | Safe and essential | Every per-class SLO depends on it |
senderid | Tens | Safe | Bounded by your registered sender IDs |
status | Under 10 | Safe | Terminal outcome set |
cause | Tens | Safe | Bounded by the published delivery code list |
encoding | 2 | Safe and valuable | TEXT versus UNICODE catches segment inflation |
network | Tens | Safe in one country | Verify before enabling for international traffic |
country | Around 200 worst case | Borderline | Fine alone, dangerous combined with network and cause |
dltTemplateId | Hundreds | Borderline, usually worth it | The scrubbing panel needs it. Bound it explicitly |
mobileNo | Unbounded | Never | One series per recipient |
transactionId | Unbounded | Never | One series per request |
msgId / uuId | Unbounded | Never | One series per message |
text / msg | Unbounded | Never | Content in a label is also a privacy incident |
The rule that keeps this safe permanently: anything that identifies an individual message or an individual recipient goes in a log line or a database row, never in a metric label. Metrics answer “how many and how bad”. Logs and traces answer “which one”. Keeping that boundary clean is what lets both scale.
Cardinality is multiplicative, which is the part people miss. Ten channels times twenty classes times fifty sender IDs times thirty causes is three hundred thousand potential series from four individually reasonable labels. Before adding a label, multiply it against the existing set and look at the number. If your metrics backend supports it, put a hard series limit per metric in place so an accidental unbounded label degrades one metric instead of the whole system.
For dltTemplateId specifically, which is genuinely useful for the scrubbing panel, bound it explicitly: maintain an allowlist of your active template IDs and label anything outside it as other. That keeps the panel useful while making the cardinality a number you chose rather than a number the data chose for you.
Alerting on Ratios, Not Counts
An alert on an absolute count fires every time you launch a campaign. That is not a tuning problem you can solve with a higher threshold, because the range of legitimate volume in a messaging system spans several orders of magnitude within the same day. Any threshold high enough to survive a campaign is too high to catch a quiet-hours failure, and any threshold low enough to catch the quiet-hours failure will page you on every campaign until someone silences it permanently. Count-based alerting on messaging systems ends in a silenced alert, always.
Ratios are volume-independent, which is the entire point.
| Alert | Expression | Suggested window | Why this shape |
|---|---|---|---|
| Delivery rate drop | delivered / submitted below a per-class baseline | 30 minutes | Volume-independent. Catches route and scrubbing problems |
| Pending climb | pending / submitted above baseline | 15 minutes | The DLR-pipeline-is-dead alarm. Nothing else catches it |
| Ambiguous surge | ambiguous / total_attempts above baseline | 5 minutes | Leading indicator, rises before the error rate |
| Oldest item age | Absolute seconds, per class | 2 minutes | The one legitimate absolute threshold, because its unit is user patience |
| Sustained backlog growth | arrival_rate > drain_rate continuously | Longer than your longest campaign spike | Distinguishes a burst from an inversion |
| Cost per delivered | Percentage change against a 7-day baseline | 6 hours | Slow-moving. Catches segment inflation and retry storms |
| Template scrubbing | Failure ratio per dltTemplateId above a high threshold | 5 minutes | Near-binary failure, so a high threshold is safe and precise |
| Reconciliation backlog | Oldest unreconciled record age | 30 minutes | Bounds billing exposure |
| Balance runway | Projected days remaining below procurement lead time | 12 hours | Prevents an outage that looks like a platform failure |
Two design points about that table.
Baselines beat constants. Comparing against a seven-day-ago value at the same hour of day handles weekday and weekend traffic shape for free, where a constant does not. Messaging traffic is intensely diurnal and weekly, so a constant threshold is implicitly a threshold for one hour of one day.
Oldest item age is deliberately the exception. It is the one metric where an absolute threshold is correct, because its unit is seconds of user waiting and user patience does not scale with your traffic volume. Thirty seconds is thirty seconds whether you sent ten messages or ten million.
Per-Message-Class SLOs
A single global SLO across all messaging traffic is arithmetic that describes no real user. It will be dominated by whichever class has the most volume, which is almost always marketing, which is the class where nobody cares. Split by class, and make the SLO measure the thing that class actually promises.
| Message class | Primary SLO | Secondary SLO | Alert posture | Behaviour under overload |
|---|---|---|---|---|
| OTP | Latency. p95 of enqueue-to-delivery under a target measured in seconds | Delivery rate | Page immediately | Shed. A late OTP is a failed OTP and guarantees a user-triggered resend, which means a second charge. Failing fast is cheaper than delivering late |
| Transactional alerts | Delivery rate | Latency at minute scale | Page during business hours | Buffer briefly, then shed. A shipment alert has a window, but it is minutes not seconds |
| Account and security notices | Delivery rate, high target | Latency, loose | Page | Buffer. Late is acceptable, missing is not |
| Scheduled reminders | Delivery rate within the scheduled window | None | Ticket | Buffer. The whole class is time-shifted by design |
| Marketing and promotional | Cost per delivered message | Delivery rate, loose | Ticket only | Buffer indefinitely, and shed before any other class |
| Two-way and conversational | Round-trip latency | Session window adherence | Page | Shed. A reply outside the session window has different mechanics and cost |
The OTP row is the inversion and it is worth stating explicitly because it contradicts the default instinct in every other queueing context. Everywhere else, buffering is the polite response to overload: hold the work, deliver it late, nobody is harmed. For OTP, buffering is actively harmful. A user who does not receive a code within roughly thirty seconds presses resend. You now pay for a second message. If the first one arrives after the resend, the user may enter a code that has already been superseded, and you have paid twice to create a support ticket. Shedding, and returning a clean error your application can present as “please try again”, costs one message and produces a better outcome. The delivery characteristics that make OTP a distinct route in the first place are described on the OTP SMS product page, and the generate and verify endpoints are documented at generate OTP and verify OTP.
One note on targets. This article deliberately states no specific numeric SLO target, no delivery percentage and no throughput figure. Those numbers depend on your routes, your destinations, your traffic mix and your commercial arrangement, and any figure quoted here would be a fabricated benchmark. Derive your targets from your own measured baseline over a representative period, and set the SLO slightly tighter than the baseline so it has room to detect regression. A target copied from a marketing benchmark article is not an SLO, it is a decoration.
The Reconciliation Backlog Is a Deferred Billing Dispute
Every ambiguous send produces a record in an unknown state. Reconciliation is the process that resolves each one to a definite outcome by looking it up in the delivery report. Most teams build the ambiguous-state handling, feel appropriately pleased about it, and then never measure whether the reconciliation actually keeps up.
Here is why that matters in money rather than in tidiness. Each unresolved record represents a message you may have paid for and cannot account for. A thousand of them is a thousand messages of unexplained spend. If your reconciliation sweep is slower than your ambiguous-outcome rate, that backlog grows without bound, and by the time anyone looks at it the delivery report window you would need to resolve the oldest entries has closed. At that point the records are permanently unresolvable. You have converted a solvable data problem into a permanent line item of unexplained spend, which is what a deferred billing dispute is.
Three metrics, all mandatory:
UNKNOWN_BACKLOG = Gauge(
    "messaging_unknown_backlog_size",
    "Count of records in unknown state awaiting reconciliation.",
    ["message_class"],
)

OLDEST_UNRECONCILED = Gauge(
    "messaging_oldest_unreconciled_age_seconds",
    "Age of the oldest record still in unknown state.",
    ["message_class"],
)

RECONCILED = Counter(
    "messaging_reconciled_total",
    "Records resolved out of unknown state, by resolution.",
    # resolution: found_delivered, found_failed, not_found_assumed_lost
    ["message_class", "resolution"],
)
Alert on messaging_oldest_unreconciled_age_seconds crossing a threshold set well inside your delivery report retention window. Not on backlog size. Size tells you how much work is queued; age tells you whether you are about to lose the ability to do it at all.
The not_found_assumed_lost resolution deserves a comment. If a record has been unknown for longer than any plausible delivery latency and no matching delivery report row exists, the most likely explanation is that the request never reached the platform, so you were not billed. That is a reasonable operational conclusion but it is an inference, not an observation. Count it separately, never fold it into found_failed, and watch its ratio. A rising not_found_assumed_lost rate means your matching logic is broken, your polling window is too narrow, or your correlation keys are wrong, and all three are bugs that will silently corrupt every delivery number you compute.
Matching a delivery report row back to your own record needs care, because the identifiers do not line up as neatly as you would like. The send response carries one top-level transactionId per request, not one per recipient, so for any multi-recipient send that field cannot identify an individual message. The delivery report rows carry msgId, uuId and mobileNo. Match on the combination of recipient, sender ID and a submit time window, then confirm with msgId. The full state machine, including the rule that an unknown record never transitions back to pending, is in Message Idempotency at Scale.
Structured Logging and Redaction
Metrics tell you something is wrong. Logs tell you which message. Both are needed, and the boundary between them is what keeps cardinality sane.
Every log line on the send path should carry a consistent field set:
| Field | Example | Purpose |
|---|---|---|
business_key | order-88213-shipped | Your deterministic idempotency key. Ties every attempt for one logical message together |
attempt_id | UUID | Per-attempt trace key. Distinguishes attempts of the same logical message |
message_class | otp | Enables per-class log filtering that matches your per-class metrics |
channel | sms | Cross-channel correlation |
senderid | SGCTST | Sender-scoped investigation |
recipient_hash | First 12 hex characters of a salted SHA-256 of the number | Correlate on a recipient without storing the number |
transaction_id | From the send response | Joins to platform-side records |
msg_id | From the delivery report | Joins the two clocks together |
outcome | accepted | Matches the metric label exactly, so a graph spike leads straight to the log query |
latency_ms | 342 | Per-request detail behind the histogram |
units | 6 | Recipients times segments, for cost attribution |
dlt_template_id | 1707161234567890123 | India scrubbing investigation |
Three redaction rules, non-negotiable:
Never log the message body at full fidelity. It contains the substituted values of every DLT variable, which in practice means names, amounts, order numbers, addresses and one-time codes. Log the template ID and the rendered length. If you must log something about the content for debugging, log a hash of it.
Never log credentials, and be aware that the failure mode here is not the obvious one. Nobody deliberately logs a password. What happens is that a debug logger dumps a whole request object, and if credentials are passed as request parameters they are in that object. Both userid/password and the apikey header are affected. Implement redaction as a logging filter that operates on the serialised output, not as discipline applied at each call site, because discipline at call sites fails the first time someone adds a new call site. The language tutorials for PHP and Python both carry a concrete implementation.
Hash recipient numbers, do not truncate them. Truncation to the last four digits feels safe and is not, because it is trivially reversible when combined with any other data you hold. A salted hash gives you the correlation ability you actually wanted with none of the exposure.
Inbound Observability: Watching Your Own Webhook Receiver
If you receive delivery receipts by webhook rather than polling, your receiver is now part of the pipeline and needs its own instrumentation. It is the most commonly uninstrumented component in any messaging integration, and it fails in a way that is specifically designed to be invisible: a broken receiver that still returns HTTP 200 will cause receipts to be discarded silently and forever, while the platform’s own view of the world says everything was delivered successfully to your endpoint.
Register a webhook with POST https://unify.smsgateway.center/SMSApi/webhook/create, passing smswebhook as your URL and smswebhookrate, documented verbatim as “DLR TPS. AT what TPS rate DLR should be forwarded to. Default is 10.” The full parameter set is on the Create Webhook API page, and the control panel walkthrough is in the webhook setup knowledge base entry.
That rate parameter is your inbound flow control and it belongs in your capacity planning. If your receiver can comfortably process well above the configured TPS, you have headroom. If it cannot, you will produce timeouts on the platform side and lose receipts, which manifests to you as a mysteriously elevated pending rate with no other symptom.
Four metrics for the receiver:
WEBHOOK_RECEIVED = Counter(
    "messaging_webhook_received_total",
    "Delivery receipt callbacks received.",
    ["outcome"],   # accepted, auth_failed, parse_failed, unmatched
)

WEBHOOK_LATENCY = Histogram(
    "messaging_webhook_handler_latency_seconds",
    "Time to acknowledge an inbound callback.",
    buckets=(0.001, 0.005, 0.01, 0.025, 0.05, 0.1, 0.25, 0.5, 1.0, 2.0),
)

WEBHOOK_SILENCE = Gauge(
    "messaging_webhook_seconds_since_last_receipt",
    "Seconds since the last inbound callback of any kind.",
)

WEBHOOK_UNMATCHED = Counter(
    "messaging_webhook_unmatched_total",
    "Callbacks that could not be matched to a known outbound record.",
)
WEBHOOK_SILENCE is the one that matters most and the one nobody builds. A receiver that has received nothing for an hour, while your application has been submitting continuously the whole time, is broken. Not slow, not degraded: broken. This gauge catches a dead receiver, a revoked registration, a DNS change, an expired certificate and a firewall rule change, all of which produce identical silence and none of which produce an error anywhere in your system. It is three lines of code and it is the highest-value alert in this section.
Two implementation notes drawn from receivers that have failed in practice.
Read the raw body before any framework parses it. A global JSON body parser applied to an endpoint that receives form-encoded data will silently produce an empty parsed object, your handler will find no fields, and it will return 200 because nothing threw. The platform sees success. You see nothing. Read raw bytes first, persist them, then parse, so that even a total parsing failure leaves you with recoverable data and a parse_failed metric increment rather than silence.
Acknowledge fast, process asynchronously. The handler latency histogram should live entirely in the low milliseconds. If you do database writes, enrichment or business logic inline, you will eventually exceed the platform’s tolerance under load and lose receipts. Persist raw, return 200, process on a worker.
The push payload field names are not publicly documented, so do not hardcode assumptions about them. Capture a real callback on your own endpoint first, record the exact schema in your repository as a fixture, and write your parser against that observed fixture. This is the same probe-first discipline that applies to any undocumented integration surface. The broader webhook architecture, including signature verification, is covered in Real-Time DLR Webhooks.
Dashboard Layout: Four Panels, In This Order
Panel ordering is not cosmetic. During an incident people read top-left first and stop reading about four panels in. Put the leading indicators where they will be seen and the volume charts where they will not.
Row one, left: oldest item age by message class. Four lines, one per class, with a horizontal threshold marker per class. This is the panel that should tell an on-call engineer within two seconds whether anything is wrong. It goes first because it is the only panel whose units are directly comparable to user patience.
Row one, right: the two clocks side by side. Submit success ratio and delivery rate over submitted, on the same time axis, explicitly annotated to indicate that the delivery line lags. This is the panel that makes the “healthy submission, degraded delivery” quadrant visible. Add pending rate as a third line here rather than hiding it elsewhere, because its climb is the DLR-pipeline alarm.
Row two, left: outcome breakdown, stacked, by cause. Not a total failure count. A stacked area by cause, so the shape of the failure tells you the category before you have read any labels. A single cause dominating a spike means a route or template problem. Many causes rising together means a broad platform or network issue.
Row two, right: cost per delivered message, with the rate card as a reference line. The gap between the two lines is your waste, drawn to scale. This is the panel that gets a finance conversation moving faster than any spreadsheet.
Everything else goes below the fold. Total volume, per-sender-ID breakdowns, network distribution, geographic splits, balance. All useful for investigation, none useful for detection. If a panel cannot change what you do in the first sixty seconds of an incident, it is not a detection panel.
One addition that pays for itself: annotate the dashboard with campaign launch events. Most large step changes in messaging metrics are caused by someone launching something, and an unannotated dashboard makes every campaign look like an incident for the first ten minutes.
Incident Review: Symptom to the Metric That Would Have Caught It
The practical test of an observability setup is not whether it produces graphs but whether, for each incident you have had, there existed a metric that would have surfaced it earlier. Run this table against your own last five incidents.
| Symptom as first observed | Actual cause | Metric that would have caught it earlier | Typical lead time gained |
|---|---|---|---|
| Users report OTPs not arriving; dashboard is green | DLR pipeline dead, messages stuck pending, delivery rate computed with the wrong denominator | Pending rate over submitted | 30 to 90 minutes |
| Monthly invoice far above forecast | A template gained a curly apostrophe and every message became three UNICODE segments | Encoding label on the submitted units counter shifting TEXT to UNICODE | Days to weeks |
| Support tickets about duplicate messages | A transport-level retry policy applied to the send path | Ambiguous-outcome rate paired with submitted units rising against a flat message count | Hours |
| One customer segment silently receiving nothing | DLT template edited, scrubbing rejecting everything on that template | Failure ratio broken down by dltTemplateId | Minutes to hours |
| Marketing campaign takes eleven hours instead of two | Worker stalled on a blocked event loop; process alive, health check green | Oldest item age, or drain rate collapsing against flat arrival rate | Hours |
| Sends start failing with an unfamiliar code | Account balance exhausted mid-campaign | Balance runway projection from the dashboard endpoint | 12 to 48 hours |
| Delivery numbers stop updating; no errors | Webhook receiver returning 200 while discarding a form-encoded body a JSON parser could not read | Seconds since last receipt gauge | Minutes |
| Reconciliation task cannot resolve old records | Backlog outgrew the delivery report window | Oldest unreconciled record age | Days |
| Throughput looks great, complaints rise | Platform rejecting fast rather than processing slowly | Drain rate paired with success ratio on the same panel | Immediate |
| Delivery rate slowly declining over weeks | Contact list decay, growing share of invalid or unreachable numbers | Cause breakdown trend, absent subscriber share rising | Weeks |
The pattern across every row is the same: the symptom was observed by a human, and a metric existed that could have observed it first. That is the only definition of observability maturity that means anything operationally.
How to Instrument a Messaging Pipeline in Ten Steps
Step 1. Write down your message classes before you write any code. Three to six of them. Every metric, SLO, alert and dashboard panel in this article is labelled by class, so getting this taxonomy wrong makes everything downstream unfixable without a migration. Classes are defined by their failure tolerance, not by which team owns them.
Step 2. Instrument the send path with a latency histogram and a units counter. Buckets chosen around your timeout, not defaulted. The counter increments by recipients times segments. Catch connect timeout and read timeout separately.
Step 3. Add explicit outcome classification. Every attempt resolves to exactly one of accepted, rejected, ambiguous or connect-failed. No exception escapes unclassified. Verify with a test that forces each branch.
Step 4. Build the oldest item age gauge. One query, exported per class, returning zero rather than null for an empty queue. This is the highest value-per-line-of-code item in the whole list.
Step 5. Build the DLR consumer and record delivery outcomes. Poll SMSApi/reports/status following the cursor, or receive webhooks, or both. Record status, cause, cost and the submit-to-delivery gap. Bounded labels only.
Step 6. Compute delivery rate against submitted. Not against delivered plus failed. Add the invariant assertion that the four outcome counts sum to submitted, and alert when it does not hold.
Step 7. Add reconciliation metrics. Backlog size, oldest unreconciled age, and resolution breakdown including not_found_assumed_lost as its own category. Alert on age, not size.
Step 8. Add the nightly contract diff and the balance projection. Fetch both error code lists, fail the job on an unhandled code, and default unknown codes to permanent. Fetch the dashboard endpoint, cross-check daily counts against your own, and project balance runway against your procurement lead time.
Step 9. Convert every alert to a ratio against a baseline. The only permitted absolute threshold is oldest item age, because its unit is user patience. Compare against the same hour seven days ago, not against a constant.
Step 10. Run the incident review table against your last five incidents. For each one, name the metric that would have caught it. If the metric does not exist, build it. If it existed and did not alert, fix the threshold. This step is what turns the previous nine from a configuration exercise into an operational practice, and it is the one most teams skip.
Decision Matrix
| Your situation | Instrument this first | Skip for now | Reasoning |
|---|---|---|---|
| Low volume, single message class, no queue | Submit outcome classification and delivery rate over submitted | Queue metrics, cardinality management | With no queue there is no oldest item age. Get the denominator right instead |
| OTP is your primary traffic | Oldest item age and enqueue-to-delivery latency histogram | Cost per delivered message | Latency is the product. Cost is secondary at OTP volumes |
| High-volume marketing, cost sensitive | Cost per delivered message and the encoding label | Sub-minute latency panels | Nobody is waiting. Segment inflation is where the money goes |
| Mixed traffic, shared queue | Message class labels everywhere, then per-class SLOs | Anything global | A global aggregate will be dominated by marketing volume and describe no real user |
| India, DLT, many templates | Failure ratio by dltTemplateId, plus CI validation | International network breakdowns | Scrubbing failures are the dominant failure mode and are near-invisible in aggregate |
| Webhook-based DLR | Seconds since last receipt gauge, before anything else | Polling metrics | A silent receiver is the failure mode, and silence is invisible by definition |
| Polling-based DLR | Poller lag and cursor progress | Webhook metrics | Your risk is falling behind, not going silent |
| Multi-channel, SMS plus WhatsApp | A normalised outcome model across both, then channel-labelled metrics | Channel-specific dashboards | The response shapes differ. Normalise once at the boundary or every panel needs special cases |
| Already have generic APM, no messaging metrics | Delivery-clock metrics only | Re-instrumenting the HTTP layer | Your APM already covers submission. Delivery is the whole gap |
| Post-incident, need something today | Oldest item age and pending rate over submitted | Everything else | These two catch the majority of incidents and take an afternoon |
Implementation Checklist
Message taxonomy
- [ ] Message classes defined by failure tolerance, three to six of them
- [ ] Every outbound record carries its class at write time
- [ ] Delivery report rows joined back to class via
msgIdoruuId, with a bounded lookup cache - [ ] Lookup misses labelled
unknownrather than dropped
Send path
- [ ] Latency recorded as a histogram with buckets straddling the timeout
- [ ] Volume counter increments by recipients times segments
- [ ] Encoding recorded as a label, TEXT versus UNICODE
- [ ] Connect timeout and read timeout classified separately
- [ ] Ambiguous outcomes counted in a dedicated metric with its own alert
- [ ]
invalidMobileparsed and counted as rejected at submission, excluded from the delivery denominator - [ ]
statusCodecoerced to string at the boundary - [ ] No automatic transport-level retry configured on the send path
Queue
- [ ] Oldest item age exported per class, returning zero for an empty queue
- [ ] Arrival rate and drain rate exported per class
- [ ] Sustained-inversion alert configured with a window longer than your longest campaign spike
- [ ] Drain rate panel paired with a success ratio panel
Delivery
- [ ] Delivery report consumed by polling with cursor, or by webhook, or both
- [ ] Delivery rate computed as delivered over submitted
- [ ] Pending rate exported and alerted on
- [ ] Invariant asserted: delivered plus failed plus pending plus rejected equals submitted
- [ ] Submit-to-delivery gap recorded as a histogram with a tail beyond ten minutes
- [ ] Negative gaps discarded rather than observed
Cost
- [ ]
costfield parsed with a decimal type, never a float - [ ] Cost per delivered message graphed against the rate card as a reference line
- [ ] Encoding-shift alert configured per sender ID
- [ ] Balance runway projected from the dashboard endpoint and alerted against procurement lead time
Reconciliation
- [ ] Unknown-state backlog size exported
- [ ] Oldest unreconciled record age exported and alerted, threshold inside the report retention window
- [ ]
not_found_assumed_lostcounted separately fromfound_failed - [ ] Reconciliation sweep duration recorded
Error handling
- [ ] Nightly diff against
SMSApi/info/responsecodesandSMSApi/info/deliverycodes - [ ] Unknown codes default to permanent, never transient
- [ ] Cause breakdown graphed as a stacked area, not a single total
- [ ] Failure ratio by
dltTemplateIdon its own panel, with a bounded template allowlist
Webhook receiver, if used
- [ ] Seconds since last receipt gauge exported and alerted
- [ ] Raw body persisted before parsing
- [ ] Handler latency histogram in the low milliseconds
- [ ] Unmatched callbacks counted separately
- [ ] Payload schema captured from a real callback and stored as a fixture
Cardinality and privacy
- [ ] No mobile number, transaction ID, message ID or content in any metric label
- [ ] Label combinations multiplied out and checked before any new label is added
- [ ] Per-metric series limit configured where the backend supports it
- [ ] Recipient numbers salted and hashed in logs, never truncated
- [ ] Credential redaction implemented as a serialisation filter, not call-site discipline
- [ ] Message bodies never logged at full fidelity
Alerting and review
- [ ] Every alert expressed as a ratio, except oldest item age
- [ ] Baselines compared against the same hour seven days ago
- [ ] Dashboard ordered by detection value, not by volume
- [ ] Campaign launches annotated on the dashboard
- [ ] Incident review table run against the last five incidents
Ten Mistakes That Keep Messaging Incidents Invisible
1. Computing delivery rate as delivered over delivered plus failed. Freezes at a healthy-looking constant during the exact failure where receipts stop arriving. Divide by submitted.
2. Graphing queue depth with a static threshold. The same number means opposite things during a campaign and during quiet hours. Use oldest item age.
3. Counting requests instead of billable units. One request can be thirty thousand units. A request counter is not a volume metric and definitely not a cost metric.
4. Averaging latency. Messaging latency distributions are strongly bimodal, so the mean sits in a valley where almost no real message lives. Use a histogram and read percentiles.
5. Putting the mobile number in a metric label. One campaign, two hundred thousand new time series, and your monitoring falls over during the event you most need to watch.
6. Catching all timeouts in one branch. Connect timeout means definitely not billed. Read timeout means possibly billed. Collapsing them discards the most consequential distinction in the system.
7. Never measuring the reconciliation backlog. Unknown records accumulate past the delivery report window and become permanently unresolvable, which converts a data problem into unexplained spend.
8. Alerting on absolute counts. Fires on every campaign, gets silenced within two weeks, and is silent during the real incident.
9. Not instrumenting the webhook receiver. A receiver returning 200 while discarding payloads is invisible from both sides. The seconds-since-last-receipt gauge is three lines and catches it.
10. One global SLO across all message classes. Dominated by marketing volume, describes no real user, and makes an OTP outage arithmetically undetectable.
FAQs
What is the single most valuable metric for a messaging pipeline? Oldest item age, exported per message class. It encodes queue depth, drain rate and stalls in one number, and its unit is seconds of user waiting, which makes threshold-setting a product decision rather than a guess. It is also the only metric here where an absolute threshold is appropriate.
Why is queue depth a bad metric on its own? Because the same value carries opposite meanings depending on context. A depth of 200,000 immediately after a campaign launch is normal. A depth of 400 on a normally empty transactional queue is an incident. Any threshold you set will either miss the second or alarm constantly on the first.
How should I compute delivery rate? Delivered divided by submitted. Never delivered divided by delivered plus failed, because that excludes pending and therefore reports healthy numbers during the failure where delivery receipts stop arriving entirely. Also assert that delivered plus failed plus pending plus rejected equals submitted.
What is an ambiguous outcome and why does it need its own metric? A send where a read timeout occurred after the request was written, so you cannot tell whether the platform accepted and billed it. It needs its own metric because its resolution has a price: retrying may double-bill and double-deliver, while not retrying may deliver nothing. Track both the rate and the age of the oldest unreconciled record.
Which SMSGatewayCenter endpoint gives me delivery data? https://unify.smsgateway.center/SMSApi/reports/status with method=getDlr, plus fromdate, todate and pageLimit. It returns a reports_dlrList array containing status, cause, globalErrorCode, cost, submitTime, deliveryTime, msgId, uuId, mobileNo, network and more. It is cursor-paced via startCursor and cursorId.
Is there a consolidated analytics endpoint? Yes. https://unify.smsgateway.center/SMSApi/dashboard/read accepts startDate and endDate with a documented 31-day maximum range and returns topBar, sentSummary, donutInfo and chartColors. Use it as a daily cross-check against your own aggregation and as the source for balance runway alerting, not as your primary metrics source.
Why do the daily rows and the donut breakdown disagree? Because they count different status sets. Each sentSummary daily row carries submitted, delivered, failed and pending, with no rejected field, while donutInfo reports five labels including Rejected. Summing the daily rows and comparing to the donut will diverge whenever anything was rejected. That is expected, not a bug in your code.
How do I catch a message that suddenly costs three times more? Record encoding as a metric label on your volume counter and alert when a sender ID that has historically been TEXT starts producing UNICODE. A single curly apostrophe, en dash, ellipsis character or rupee sign substituted into a template forces the whole body to UCS-2 at 70 characters per segment instead of 160.
Should I use polling or webhooks for delivery receipts? Both, if you can. Webhooks give you low latency but fail silently when your receiver breaks. Polling is slower but self-healing and safe to retry because it is a read endpoint. If you run webhooks alone, the seconds-since-last-receipt gauge is mandatory, because a dead receiver produces no error anywhere.
What labels are safe on messaging metrics? Channel, message class, sender ID, status, cause, encoding and network are all bounded and safe. Country is borderline when combined with others. Mobile number, transaction ID, message ID and message content are never acceptable, because each produces one time series per message and will take your metrics backend down during a campaign.
How do I set an SLO target? From your own measured baseline over a representative period, set slightly tighter than the baseline so it can detect regression. This article deliberately quotes no numeric target, because delivery percentages and latencies depend on your routes, destinations, traffic mix and commercial arrangement. A number copied from a benchmark article is a decoration, not an SLO.
Why does OTP get shed rather than buffered under overload? Because a late OTP is a failed OTP. A user who waits more than roughly thirty seconds presses resend, which costs a second message, and the superseded first code can then cause a failed verification and a support ticket. Failing fast costs one message and produces a cleaner user experience.
How do I detect a DLT template scrubbing failure quickly? Graph failure ratio broken down by dltTemplateId, which appears on every delivery report row. Scrubbing failures are near-binary and sender-scoped: one template goes from zero to total failure within a minute. On an aggregate error graph, one template out of two hundred failing completely might move the global rate by half a percent and be invisible.
Can I load-test my pacing without delivering messages? The send endpoint accepts testMessage, documented as enabling a test where messages will not be delivered. What is not documented is whether credits are consumed, whether a delivery receipt is generated, or whether the response body differs. Determine those three empirically on your own account by checking balance before and after and polling the report for that window, and record the result in your runbook before relying on it.
What This Article Deliberately Does Not Claim
Stating gaps explicitly is more useful than filling them with plausible numbers.
- No numeric TPS ceiling. No throughput limit for the HTTP API is published. Any figure here would be invented. Discover your own ceiling empirically with an adaptive controller rather than coding against a guess.
- No numeric SLO or delivery percentage target. These depend on routes, destinations, traffic mix and commercial terms. Derive them from your own baseline.
- No webhook push payload schema. The outbound callback field names are not publicly documented. Capture a real callback and store it as a fixture rather than assuming field names.
- No claim about
testMessagecredit consumption or DLR generation. The documentation states only that messages will not be delivered. The other behaviours are undocumented and must be determined per account. - No rate limits stated for the reporting or dashboard endpoints. Poll at a conservative interval and back off on any error, rather than assuming a budget.
- No claim about delivery report retention window length. Set your reconciliation alert threshold conservatively inside whatever window you observe on your own account, and verify it.
Instrument your messaging pipeline against real endpoints. Every metric in this guide is built from documented SMSGatewayCenter APIs:
SMSApi/sendfor submission,SMSApi/reports/statusfor the delivery funnel,SMSApi/dashboard/readfor cross-checking, and the two live error code lists for contract validation. Start with a free demo account, pull the SMS Postman collection to see every response shape before you write a parser, and browse the full API reference. If you are running enough volume that an undetected delivery drop is expensive, talk to the team about routes and reporting for your traffic mix.